
Financial charts and graphs are the foundation of every pitchbook and report in the industry. To present data as clearly as possible for your clients and stakeholders, it’s vital to create Excel graphs and charts that help you tell impactful stories with your data.
In this blog we share our top tips on how to build beautiful financial charts and graphs in Excel, with an insight on how finance teams are currently creating professional graphs and charts today.
Choose the right chart or graph in Excel
What is an Excel chart or graph?
Excel charts and graphs are visual representations of data taken from your worksheets in Excel. Finance professionals use charts and graphs in Excel to represent different trends and highlight their analysis of various datasets.
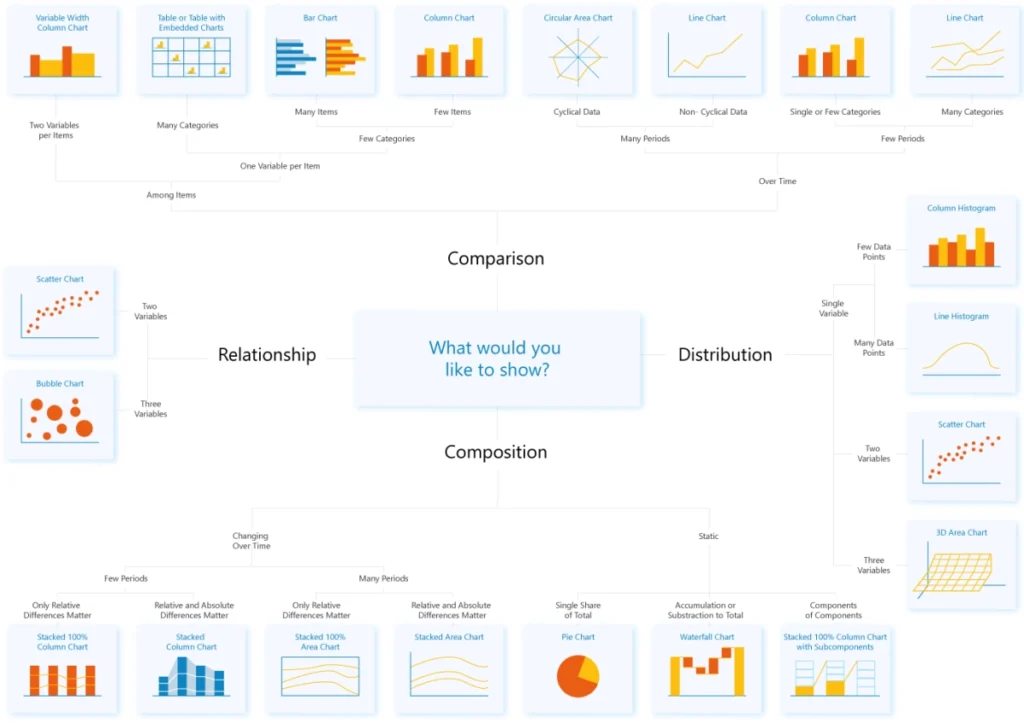
Which Excel chart or graph should I use?
When building charts or graphs in Excel, it’s important to present your data in the best format.
A bar chart is especially useful for a portfolio analysis, whereas more complex charts like waterfall charts are better for displaying a cashflow analysis month-on-month. Using these Excel graphs in the right context will make your final deliverable look more professional and easier to understand.
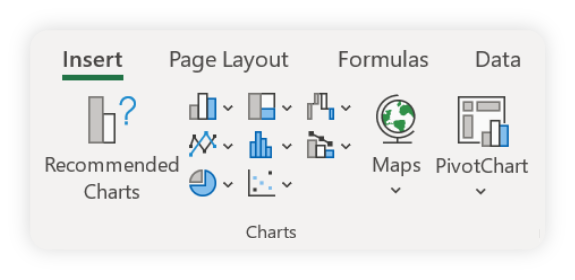
How to make a chart or graph in Excel
Every chart in Excel starts from the same place: the ‘Insert’ tab. Within this tab you have access to all 18 types of default charts that Excel offers.
Let’s say you wanted to make a bar chart in Excel:
- Select the desired data range in your workbook
- Head to the ‘Insert’ tab and select the line graph option from the ribbon
- Select the bar chart you like best from the different options provided
- Just like that, you’ve built your first Excel bar chart
Top tip
If you’re unsure of what chart to use in a specific scenario, use the ‘Recommended Charts’ feature within the ‘Insert’ tab of your Excel ribbon.
Adjust the series overlap and gap width on charts
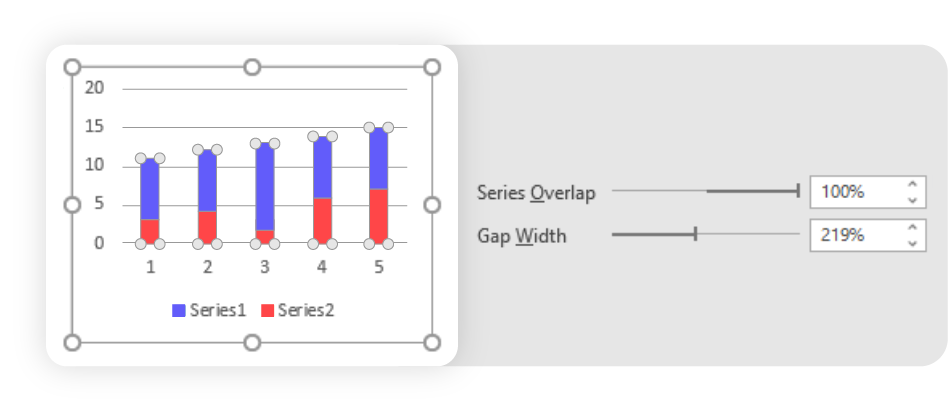
When creating bar charts or waterfall charts, Excel uses thin bars with wide spacing by default. We find the opposite works better as it makes it easier to visually compare data. The bars should be wider and the distance between the bars narrower. You can achieve this by adjusting the gap width and series overlap of your chart.
How to adjust gap width and series overlap in Excel:
- Click on the data values within the chart you would like to edit. This will show the ‘Format Data Series’ pane.
- Click on ‘Gap Width’ – you want less white space but enough to differentiate between blocks
Did you know, with UpSlide you can automatically apply your default series overlap and gap width across all financial charts and graphs in Excel?
Remove background lines from graphs
When analyzing financial charts in Excel, there can often be a lot of data to interpret at first glance. That’s why most finance teams view it as best practice to remove all background lines from graphs in Excel to make the data as easy as possible.
Even with these two pie charts below, the default grid lines interfere with the chart design and the data we want to represent:
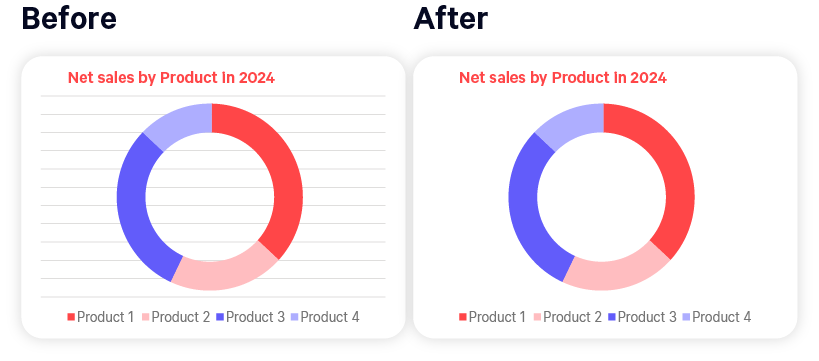
How to remove gridlines on Excel charts:
- Head to the ‘Page Layout’ tab in your Excel ribbon
- Within the ‘Sheet Options’ section, find the ‘Gridlines’ column and untick ‘View
Once you’ve done this, the background lines will disappear across your whole workbook.
Remove unnecessary axes
Sometimes a second axis can be useful for data visualization in Excel. For example, if you wanted to represent data points as both a numerical value and also a percentage. However, if your second axis is overcomplicating your Excel charts for your final deliverable, it’s good to know how to remove it with ease.
To remove a second axis:
- Select the chart you want to edit.
- The ‘Chart Design’ tab will appear at the top of your ribbon
- Under ‘Add Chart Element’, click on ‘Axes’
- Then make sure to untick the ‘Secondary Vertical’ box
- You’ll no longer have a secondary axis on your Excel chart!

Top tip:
Always order your axis in descending or chronological order so it is simple, clear and easy to understand.
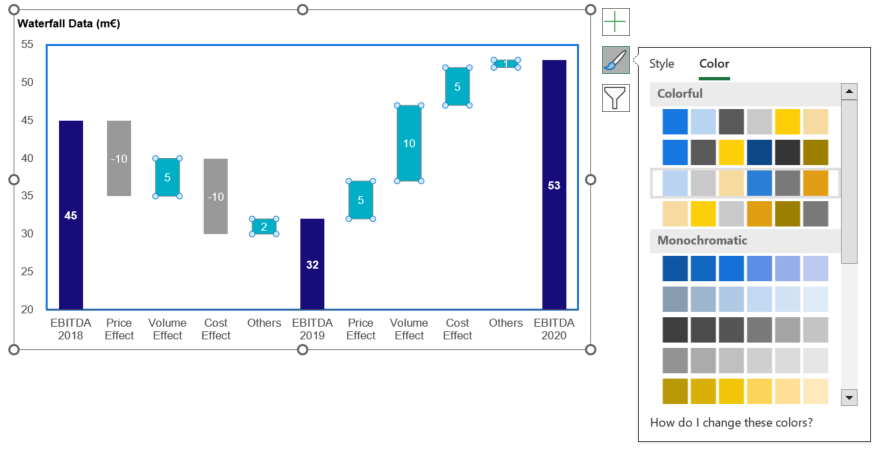
Add clear formatting to your Excel charts
Presenting your Excel graphs and charts with clear formatting is essential in making them look more professional. If you’re presenting financial charts as part of an internal report, it’s best to format the charts into your company branding. In fact, for 78% of finance professionals, it is a prerequisite for deliverables to comply with their graphic charter.
If you’ve created Excel graphs and charts as part of an external client deliverable, we recommend formatting them into your client’s branding.
How to format charts in Excel:
- Select your desired chart in Excel
- Next to the chart, select the paintbrush icon to edit the chart style
- Apply the desired style presets under the ‘Style’ pop-up
- Within the ‘Color’ pop-up you can also edit the colour of each bar, line or segment in your chart
This will help you create professional graphs and charts in Excel for both internal and external deliverables.
How finance teams are building beautiful charts and graphs in Excel
Colliers is a global real estate and investment management firm with over 18,000 professionals operating in 66 countries. Their Valuation & Advisory team provides valuation reports to a large number of financial institutions, private sector and government clients.
The team adopted UpSlide in 2020 to automate the creation of beautiful financial charts and graphs in Excel. Now their operators can make graphs in Excel with one click, and pre-apply their company branding across their whole workbook.
The Excel Formatting Tools have been key in empowering teams to create brand-compliant reports, quickly and easily. With UpSlide, we can apply our brand formatting to any Excel graph or table with a single click.

UpSlide’s Excel Charts enables finance teams like Colliers to standardize all charts across Microsoft 365 applications with the ability to build and format Marimekko, Waterfall, and Stacked Waterfall charts in one click. That means more time for data visualization and effective analysis.
Discover how to automate complex graphs and charts in Excel with UpSlide.
If you found this blog useful, bookmark our Knowledge Hub for more efficiency tips on how to work more efficiently in Microsoft 365.
TL;DR
Remove unnecessary elements that clutter the chart and make it harder to understand. For example, eliminate unnecessary axes.
Distribute bars evenly by making them wider and reducing the spacing between them. Additionally, remove background lines that can be distracting.
Finally, maintain consistency in your design choices by formatting all charts and graphs to your company’s graphic charter.