
It is no secret that financial analysts spend the majority of their working day on the Microsoft Office suite, and more specifically Excel. For this reason, knowing the key formulas which save you the most time is more important than ever, in order to become as efficient as possible.
If you haven’t already read our previous article, check out some new exciting Excel formulas.
But if you are looking to focus on finance functions, download our demo spreadsheet to get to know our top 6!
FV – Future Value
This function is used to calculate the Future Value of an investment for fixed, repeated payments where the interest rate remains the same.
Formula =FV(rate, nper, pmt, [pv], [type])
Take a look at this excelfunctions.net article for some examples of how to use it and for more in-depth information on the arguments.
XNPV – Net Present Value
This formula is the opposite of the one above, working to calculate the company’s Net Present Value using irregular dates, taking into account discount rate applied, value of in / outflows at different dates for these transactions. XNPV is more specific as it uses precise dates that relate to each cash flow in the series, whilst the NPV formula assumes that time periods remain the same.
Formula =XNPV(rate, values, dates)
Take a look at some examples here! https://exceljet.net/excel-functions/excel-xnpv-function
XIRR – Extended Internal Rate of Return
XXIR calculates a business’ internal rate of return for different cash flows according to different dates.
Returns have always been the basic benchmarks for investors while assessing and measuring potential or existing growth. IRR indicates the expected annual growth over time in a way that’s easier to compare investments than using just NPV. The rate of return calculated by XIRR is the interest rate corresponding to XNPV = 0. It can be used to compare potential investments or calculate returns on investments where there are multiple transactions happening at different times.
Finance analysts should use XIRR over the regular IRR formula. Most cash flow periods won’t match with IRR. Therefore, it is better to use XIRR. Cash flows will be different for different periods, and XIRR provides accurate details about each and every transaction for the specified time.
Formula =XIRR(value, dates, [guess])
MIRR – Modified Internal Rate of Return
This formula works to calculate the expected return of a series of cash flows whilst still factoring in the cost of borrowing (discount rate) and reinvestment rate.
Finance analysts use MIRR to calculate and understand the success or failure of an investment compared to another investment.
The standard Internal Rate of Return (IRR) assumes that all cash flows received from an investment are reinvested at the same rate. The Modified Internal Rate of Return (MIRR) allows you to set different reinvestment rates for cash flows received. MIRR arrives at a single solution for any series of cash flows, while IRR can have two solutions for a series of cash flows that alternate between negative and positive.
Formula =MIRR(values, finance_rate, reinvest_rate)
Here’s what Microsoft says about the MIRR function
EFFECT – Effective Interest Rate
The EFFECT function calculates the effective annual interest rate for non-annual compounding loans. Analysts often need to make decisions on which financial loan will be best for a business. The EFFECT function is helpful as it makes it easier to draw comparisons between loans with different rates or periods, ultimately helping to make a decision, and shows how compounding periods change the Effective Interest Rate.
Formula =EFFECT(nominal_rate, npery)
Be sure to check out this website to gain an in-depth look on how to use the function.
PMT – Payment
This is probably the most commonly used feature in Excel by Finance analysts, as it is a financial function that calculates the payment for a loan based on a constant interest rate, the number of periods and the loan amount.
This function is frequently used in Real Estate financial modeling where they use this formula to calculate the present value of investments after considering number of periods and rate of interest. It provides total payment, including the interest and principal amounts.
The Excel PMT function calculates the constant periodic payment required to pay off (or partially pay off) a loan or investment, with a constant interest rate, over a specified period.
Formula =PMT(rate, nper, pv, [fv], [type])
Top tip
When used in conjunction with IPMT and PPMT, analysts can make a detailed report of all the investments and their expected interest and principal amounts.
For some examples on how to use the formula, look here.
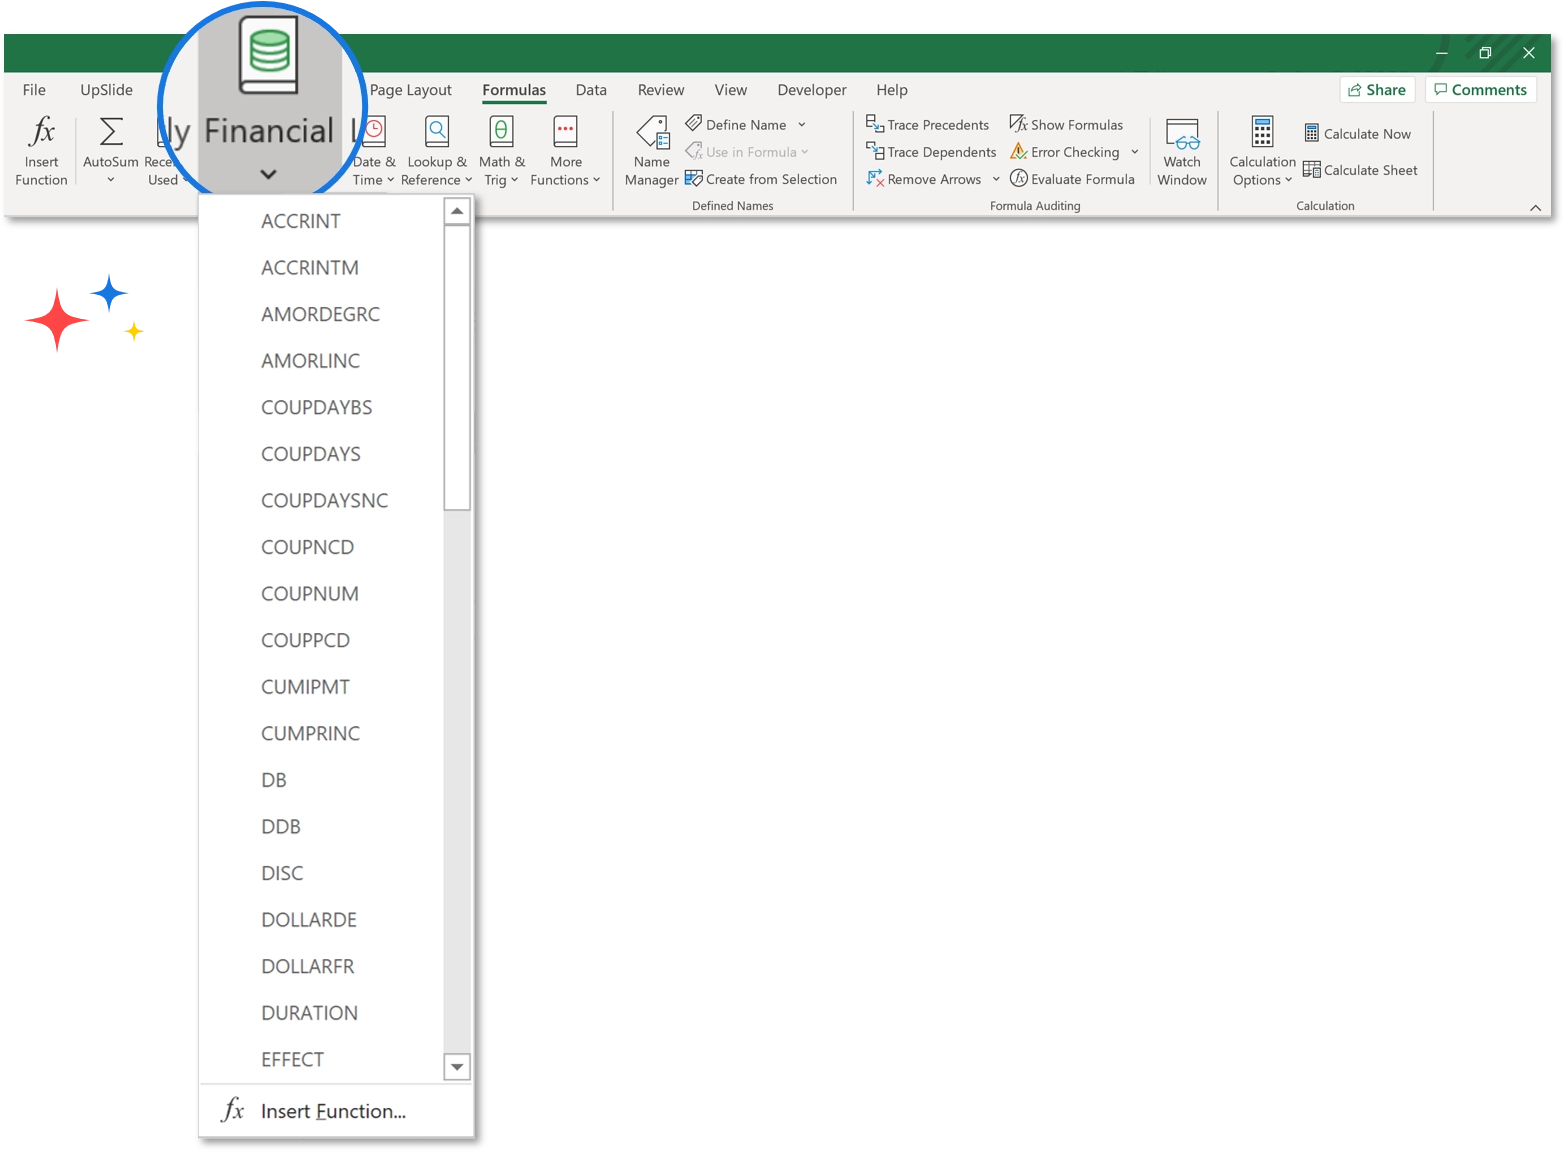
BONUS: discover more Financial formulas
In Excel, under the Formulas tab, there are many pre-made Excel formulas which can be very useful too.